


EIA Report – Volume 1 (Chapters)
- Chapter 1 Introduction
- Chapter 2 Site Description
- Chapter 3 Alternatives and Design Evolution
- Chapter 4 Description of Development
- Chapter 5 EIA Process and Methodology
- Chapter 6 Landscape and Visual Assessment
- Chapter 7 Cultural Heritage
- Chapter 8 Ornithology
- Chapter 9 Ecology
- Chapter 10 Hydrology and Hydrogeology
- Chapter 11 Geology, Ground Conditions and Peat
- Chapter 12 Access, Traffic and Transport
- Chapter 13 Forestry
- Chapter 14 Noise
- Chapter 15 Aviation
- Chapter 16 Shadow Flicker
- Chapter 17 Telecommunications
- Chapter 18 Climate Change Impact Assessment
- Chapter 19 Schedule of Mitigation
EIA Report – Volume 2 (Figures)
[tabgroup_inner type=”vertical”]
[tab_inner title=”Chapter 1″]
Volume 2 – Figures
No documents
[/tab_inner] [tab_inner title=”Chapter 2″] [/tab_inner] [tab_inner title=”Chapter 3″]No Documents
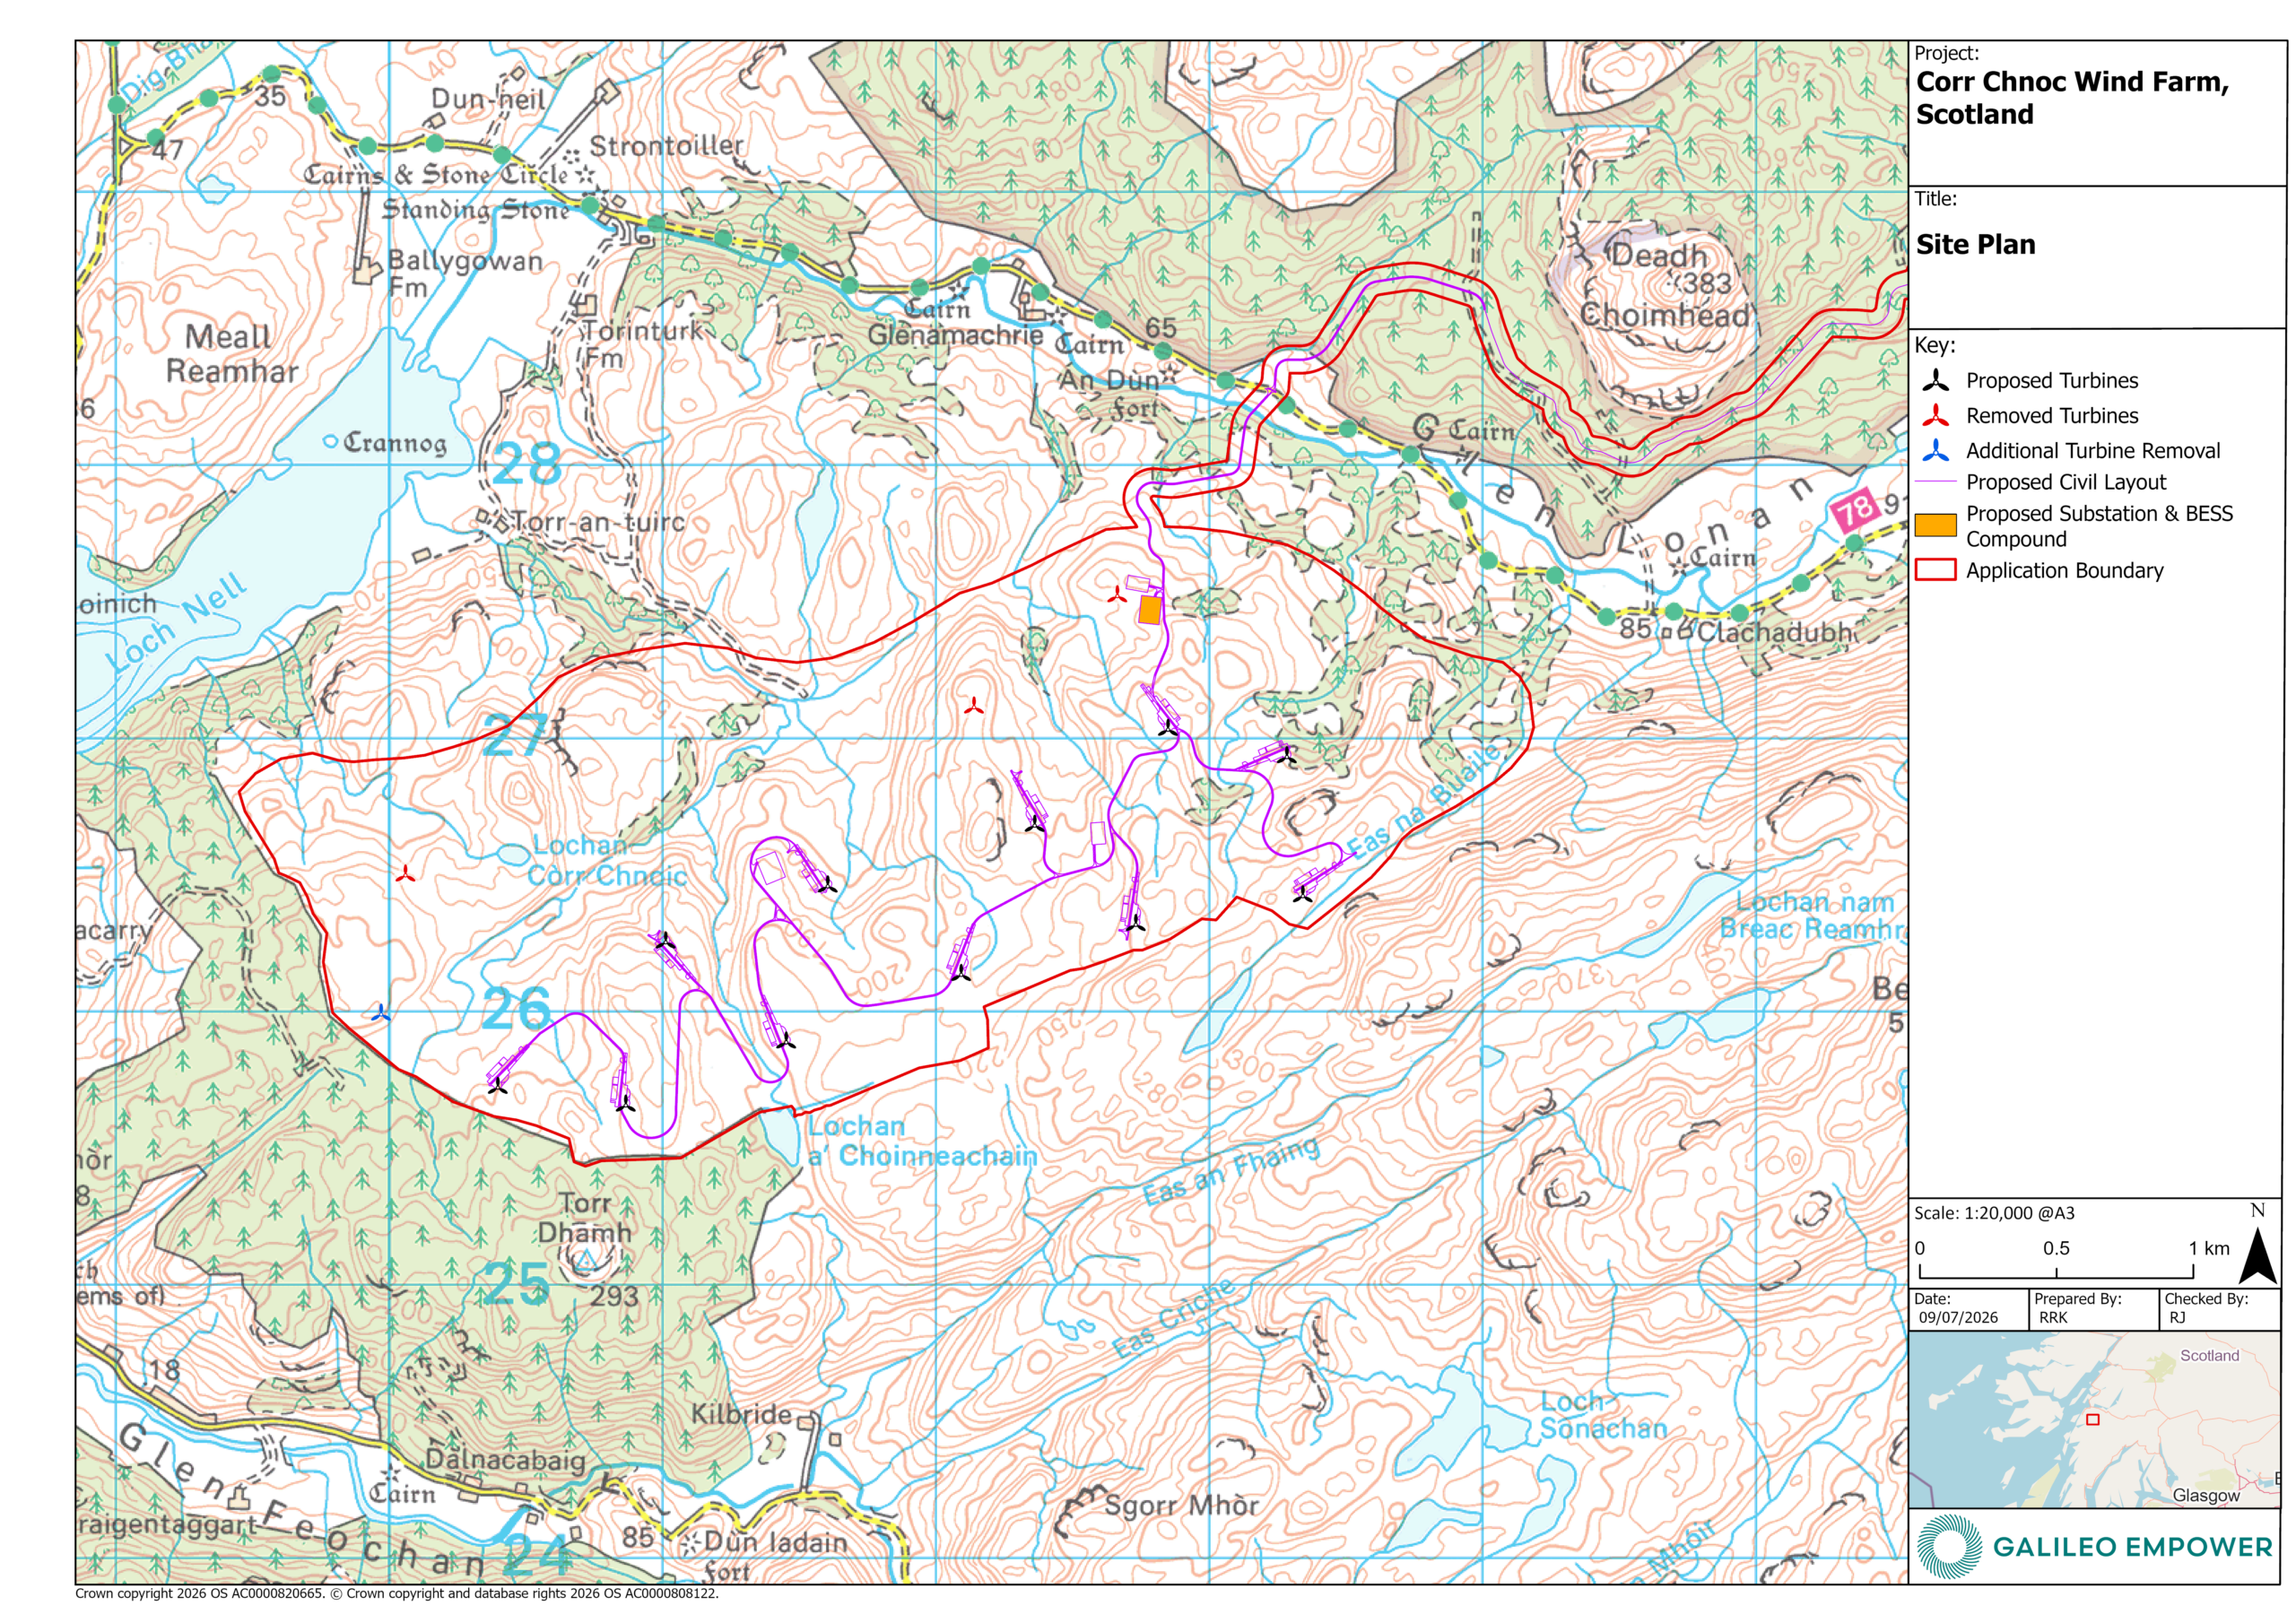
[/tab_inner] [tab_inner title=”Chapter 4″]- Figure 4.1 – Site Plan
- Figure 4.2 – Fearnoch Access Plan
- Figure 4.3 – Indicative Turbine Elevations
- Figure 4.4 – Typical Turbine Foundations
- Figure 4.5 – Typical Crane Hardstandings
- Figure 4.6 – Typical Cable Trench Details
- Figure 4.7 – Typical Track Details
- Figure 4.8 – Typical Watercourse Crossing Methods
- Figure 4.9 – Onsite Substation and BESS Compound Location – Compound 3
- Figure 4.10 – Temporary Construction Compound 1 Location
- Figure 4.11 – Temporary Construction Compound 2 Location
- Figure 4.12 – Temporary Construction Compound 4 Location
- Figure 4.13 – Indicative New Site Junction for Abnormal Loads
- Figure 4.14 – Existing Site Junction for Construction traffic
- Figure 4.15 – Indicative Substation and Compound Layout
- Figure 4.16 – Indicative Substation Plan and elevations
- Figure 4.17 – Indicative BESS Container Plan & Elevations
- Figure 4.18 – Borrow Pit 1 Design
- Figure 4.19 – Borrow Pit 2 Design
No Documents
[/tab_inner] [tab_inner title=”Chapter 6″]- Figure 6.1 – Study Area
- Figure 6.2 – Landform
- Figure 6.3a – Landscape Character
- Figure 6.3b – Landscape Character – Argyll and Bute Landscape Wind Energy Capacity Study
- Figure 6.4 – Landscape Designations and Wild Land Areas
- Figure 6.5 – Principal Visual Receptors
- Figure 6.6a – Blade Tip ZTV with ViewpointsFigure
- 6.6b – Blade Tip ZTV with Viewpoints 20km
- Figure 6.6c – Blade Tip ZTV with Viewpoints A1
- Figure 6.6d – Blade Tip ZTV with Viewpoints A0
- Figure 6.7a – Hub Height ZTV with Viewpoints
- Figure 6.7b – Hub Height ZTV with Viewpoints 20km
- Figure 6.7c – Hub Height ZTV with Viewpoints A1
- Figure 6.7d – Hub Height ZTV with Viewpoints A0
- Figure 6.8 – Horizontal Angle ZTV
- Figure 6.9a – Landscape Character with ZTV
- Figure 6.9b – Landscape Character with ZTV 20km
- Figure 6.10a – Landscape Designations with ZTV
- Figure 6.10b – Landscape Designations with ZTV 20km
- Figure 6.10c – Wild Land with ZTV
- Figure 6.11a – Principal Visual Receptors with ZTV
- Figure 6.11b – Principal Visual Receptors with ZTV 20km
- Figure 6.12 – Cumulative Developments
- Figure 6.13 – Cumulative ZTVs
- Figure 6.14 – Baseline Light Pollution
- Figure 6.15 – ZTV of Turbine Hub Lighting Proposed Reduced Aviation Lighting Scheme
- Figure 6.16 – Hub Lighting Intensity ZTV
- Figures 7.1 – 7.15 – Designated Heritage Assets – Outer Study Area
- Figure 7.34 – Heritage Assets Taken Forward for Assessment
- Figure 8.1 StudyAreas
- Figure 8.2 Vantage Points and Viewsheds
- Figure 8.3 Designated Sites
- Figure 8.4 Red-throated Diver Flights
- Figure 8.5 Golden Eagle Flights
- Figure 8.6 Hen Harrier Breeding Season Flights
- Figure 8.7 Hen Harrier Non-Breeding Season Flights
- Figure 8.8 Other Raptor Flights
- Figure 8.9 Black Grouse Activity
- Figure 8.10 Cumulative Wind Farm Projects
- Figure 9.1 – Sites Designated for Ecological Interest
- Figure 9.2 – Habitat Survey Areas
- Figure 9.3 – Protected Mammal Survey Areas
- Figure 9.4a – Habitat Survey Results
- Figure 9.4b – Habitat Survey Results
- Figure 9.4c – Habitat Survey Results
- Figure 9.4d – Habitat Survey Results
- Figure 9.4e – Habitat Survey Results
- Figure 9.5 – Peatland Condition
- Figure 9.6 – Terrestrial Mammal Results
- Figure 9.7 – Features with Bat Roost Potential
- Figure 9.8a – Bat Activity – Contacts (Spring 2023)
- Figure 9.8b – Bat Activity – Contacts (Summer 2023)
- Figure 9.8c – Bat Activity – Contacts (Autumn 2023)
- Figure 9.9a – Bat Activity – Bat Activity Index (Spring 2023)
- Figure 9.9b – Bat Activity – Bat Activity Index (Summer 2023)
- Figure 9.9c – Bat Activity – Bat Activity Index (Autumn 2023)
- Figure 9.10 – Fish Habitat Survey
- Figure 9.11 – Outline Habitat Management Plan
- Figure 10.1 Hydrology
- Figure 10.2 Surface Water Catchments
- Figure 10.3 Abstractions and Discharges
- Figure 10.4 Watercourse Crossings
- Figure 11.1 Bedrock Geology
- Figure 11.2 Superficial Geology
- Figure 11.3 Soils
- Figure 11.4 Peat Depth Plan
- Figure 11.5 Surface Firmness
- Figure 11.6 Land Capability for Agriculture
- Figure 11.7 PLHRA – Peat Depth (Peat Slide)
- Figure 11.8 PLHRA – Peat Depth (Bog Burst)
- Figure 11.9 PLHRA – Slope Gradient (Peat Slide)
- Figure 11.10 PLHRA – Slope Gradient (Bog Burst)
- Figure 11.11 PLHRA – Slope Shape (Peat Slide)
- Figure 11.12 PLHRA – Slope Shape (Bog Burst)
- Figure 11.13 PLHRA – Substrate (Peat Slide & Bog Burst)
- Figure 11.14 PLHRA – Peat Morphology (Peat Slide & Bog Burst)
- Figure 11.15 PLHRA – Peat Drainage (Peat Slide & Bog Burst)
- Figure 11.16 PLHRA – Landslide Prevalence (Peat Slide & Bog Burst)
- Figure 11.17 PLHRA – Presence of Forestry (Peat Slide & Bog Burst)
- Figure 11.18 PLHRA – Previous land use (Peat Slide & Bog Burst)
- Figure 11.19a-19c PLHRA – Estimated Likelihood of Peat Landslide
- Figure 11.19d-19f PLHRA – Estimated Likelihood of Peat Landslide
- Figure 11.20a-20c PLHRA – Estimated Likelihood of Bog Burst
- Figure 11.20d-20f PLHRA – Estimated Likelihood of Bog Burst
- Figure 11.21 PLHRA – Adverse Consequences
- Figure 11.22a-22c PLHRA – Peat Slide Risk
- Figure 11.22d-22f PLHRA – Peat Slide Risk
- Figure 11.23a-23b PLHRA – Bog Burst Risk
- Figure 11.23c-23d PLHRA – Bog Burst Risk
- Figure 11.23e-23f PLHRA – Bog Burst Risk
- Figure 12.1 – Study Area
- Figure 12.2 – Traffic Counter Locations
- Figure 12.3 – Personal Injury Accident Locations
- Figure 12.4 – AIL Route
- Figure 13.1 – Forestry Study Area
- Figure 13.2 – Baseline Species Composition
- Figure 13.3 – Development Felling Access Route Restock Species
No Documents
[/tab_inner] [tab_inner title=”Chapter 16″] [/tab_inner] [tab_inner title=”Chapter 17″] [/tab_inner] [tab_inner title=”Chapter 18″]No Documents
[/tab_inner] [tab_inner title=”Chapter 19″]No Documents
[/tab_inner] [/tabgroup_inner]
EIA Report – Volume 3 (Visualisations)
[tabgroup_inner type=”vertical”]
[tab_inner title=”Chapter 6″]
[/tab_inner]
[/tabgroup_inner]
Volume 3 – Landscape and Visual Visualisations
EIA Report – Volume 4 (Technical Appendices)
[tabgroup_inner type=”vertical”]
[tab_inner title=”Chapter 1″]
Volume 4 – Technical Appendices
No Technical Appendices
[/tab_inner] [tab_inner title=”Chapter 2″]No Technical Appendices
[/tab_inner] [tab_inner title=”Chapter 3″]No Technical Appendices
[/tab_inner] [tab_inner title=”Chapter 4″] [/tab_inner] [tab_inner title=”Chapter 5″]No Technical Appendices
[/tab_inner] [tab_inner title=”Chapter 6″]- Technical Appendix 6.1 – LVIA Methodology
- Technical Appendix 6.2 RVAA – Blade Tip ZTV – residential
- Technical Appendix 6.2 RVAA – Figure 1 – RVAA Wirelines Part 1
- Technical Appendix 6.2 RVAA – Figure 1 – RVAA Wirelines Part 2
- Technical Appendix 6.2 RVAA
- Technical Appendix 7.1 – Archaeological Desk-based Assessment Figures
- Technical Appendix 7.1 – Archaeological Desk-based Assessment
- Technical Appendix 7.2 – Settings Assessment Figures
- Technical Appendix 7.2 – Settings Assessment
- Technical Appendix 7.3 – Cultural Heritage Visualisations
- Technical Appendix 8.1 – Ornithology
- Technical Appendix 8.1 – Annex A: Ornithological Legal Protection
- Technical Appendix 8.1 – Annex B: Ornithological Survey Methodologies
- Technical Appendix 8.1 – Annex C: Ornithological Survey Effort and General Information
- Technical Appendix 8.1 – Annex D: Ornithological Survey Results
- Technical Appendix 8.1 – Annex E: Collision Risk Assessments
- Technical Appendix 8.3 – White-tailed Eagle Population Model
- Technical Appendix 9.1 – Habitats & Vegetation
- Technical Appendix 9.2 – Protected Species
- Technical Appendix 9.3 – Bats
- Technical Appendix 9.4 – Fish Habitat
- Technical Appendix 9.5 – Deer Assessment
- Technical Appendix 9.6 – Outline HMP
- Technical Appendix 10.1 – Consultee Correspondance
- Technical Appendix 10.2 – Licenced Abstractions and Discharges
- Technical Appendix 10.3 – HCSM Schematic
- Technical Appendix 10.4 – Watercourse Crossing Schedule
- TA 11.1a – Peat Survey Report_Wind Farm Area
- TA 11.1b – Laboratory Soil Analysis Results – Wind Farm Area
- TA 11.1c – Peat Survey Report – Fearnoch Forest Access Area
- TA 11.1d – Laboratory Soil Analysis Results – Fearnoch Forest Access Area
- TA 11.2 – Peat Landslide Hazard and Risk Assessment
- TA 11.3 – Outline Peat Management Plan
- TA 11.4 – Input to GRR
- Technical Appendix 12.1 – Transport Assessment (Part 1)
- Technical Appendix 12.1 – Transport Assessment (Part 2)
- Technical Appendix 12.1 – Transport Assessment (Part 3)
- Technical Appendix 12.1 – Transport Assessment (Part 4)
- Technical Appendix 12.1 – Transport Assessment (Part 5)
No Technical Appendices
[/tab_inner] [tab_inner title=”Chapter 14″]- Technical Appendix 14.1 – Cumulative Turbine Noise Emission Data
- Technical Appendix 14.2 – Calibration Certification
- Technical Appendix 14.3 – Details of Construction Plant
- Technical Appendix 15.1 – Corr Chnoc – Oban Turbulence and Safeguarding Report
- Technical Appendix 15.2 – Aviation Lighting Technical Report
No Technical Appendices
[/tab_inner] [tab_inner title=”Chapter 17″]No Technical Appendices
[/tab_inner] [tab_inner title=”Chapter 18″] [/tab_inner] [tab_inner title=”Chapter 19″]No Technical Appendices
[/tab_inner] [/tabgroup_inner]


